A 60 SECOND GLANCING EYE ON BUSINESS, MARKETS & ECONOMY

Global Markets


Live World Indices are powered by Investing.com

Thursday, 25 February 2016

母#ロシアの石油ベースの経済暴落

Can things get any worse for Russia? You're about to find out


For a decade, Dmitri Barinov has been following the volatile economy of his homeland from the safe distance of Union Investment’s offices in Frankfurt. Last year, as other money managers were steering clear of Russia’s broken economy, the Moscow-born Barinov pulled off something of a coup: He persuaded his bosses to take the plunge and buy Russian government bonds. It was a narrow bet, but he ended up winning because the central bank—after implementing the biggest interest rate hike since the Russian financial crisis in 1998 to prop up the collapsing ruble—changed course and aggressively backtracked. In the first 10 months of 2015, ruble-denominated government bonds handed investors such as Barinov a 25 percent return in dollar terms, the biggest gain for local bonds anywhere.

Read More

Saturday, 20 February 2016

The Great Global Famine - The Aftermath of Peak Oil

The Coming Famine

By Peter Goodchild

http://www.survivepeakoil.blogspot.ca/2016/02/the-coming-famine.html 


Humanity has struggled to survive through the millennia in terms of Nature's tendency to balance population size with food supply. The same is true now, but population numbers have been soaring for over a century. Oil, the limiting factor, is close to or beyond its peak extraction. Without ample, free-flowing oil, it will not be possible to support a population of several billion for long. Without fossil fuels for fertilizer and pesticides, as well as for cultivating and harvesting, crop yields drop by more than two-thirds (Pimentel, 1984; Pimentel & Hall, 1984; Pimentel & Pimentel, 2007). 

Over the next few decades, there will be famine on a scale many times larger than ever before in human history. It is possible, of course, that warfare and plague, for example, will take their toll to a large extent before famine claims its victims. The distinctions, in any case, can never be absolute: often "war + drought = famine" (Devereux, 2000, p. 15), especially in sub-Saharan Africa, but there are several other combinations of factors.


Although, when discussing theories of famine, economists generally use the term "neo-malthusian" in a derogatory manner, the coming famine will be very much a case of an imbalance between population and resources. The ultimate cause will be fossil-fuel depletion, not government policy (as in the days of Stalin or Mao), warfare, ethnic discrimination, bad weather, poor methods of distribution, inadequate transportation, livestock diseases, or any of the other variables that have often turned mere hunger into genuine starvation. 

The increase in the world’s population has followed a simple curve: from about 1.7 billion in 1900 to over 7 billion today. A quick glance at a chart of world population growth, on a broader time scale, shows a line that runs almost horizontally for thousands of years, and then makes an almost vertical ascent as it approaches the present. That is not just an amusing curiosity. It is a shocking fact that should have awakened humanity to the realization that something is dreadfully wrong.


Mankind is always prey to its own "exuberance," to use Catton’s term. That has certainly been true of population growth. In many cultures, "Do you have any children?" or, "How many children do you have?" is a form of greeting or civility almost equivalent to "How do you do?" or, "Nice to meet you." World population growth, nevertheless, has always been ecologically hazardous. With every increase in human numbers we are only barely able to keep up with the demand: providing all those people with food and water has not been easy. We are always pushing ourselves to the limits of Earth’s ability to hold us (Catton, 1982).


The Great Global Famine - The Aftermath of  Peak Oil

The End of Fossil Energy


Friday, 19 February 2016

Energy Physics Sets the Stage for Economic Collpase

The Physics of Energy and the Economy


I approach the subject of the physics of energy and the economy with some trepidation. An economy seems to be a dissipative system, but what does this really mean? There are not many people who understand dissipative systems, and very few who understand how an economy operates. The combination leads to an awfully lot of false beliefs about the energy needs of an economy.
The primary issue at hand is that, as a dissipative system, every economy has its own energy needs, just as every forest has its own energy needs (in terms of sunlight) and every plant and animal has its own energy needs, in one form or another. A hurricane is another dissipative system. It needs the energy it gets from warm ocean water. If it moves across land, it will soon weaken and die.
There is a fairly narrow range of acceptable energy levels–an animal without enough food weakens and is more likely to be eaten by a predator or to succumb to a disease. A plant without enough sunlight is likely to weaken and die.
In fact, the effects of not having enough energy flows may spread more widely than the individual plant or animal that weakens and dies. If the reason a plant dies is because the plant is part of a forest that over time has grown so dense that the plants in the under story cannot get enough light, then there may be a bigger problem. The dying plant material may accumulate to the point of encouraging forest fires. Such a forest fire may burn a fairly wide area of the forest. Thus, the indirect result may be to put to an end a portion of the forest ecosystem itself.
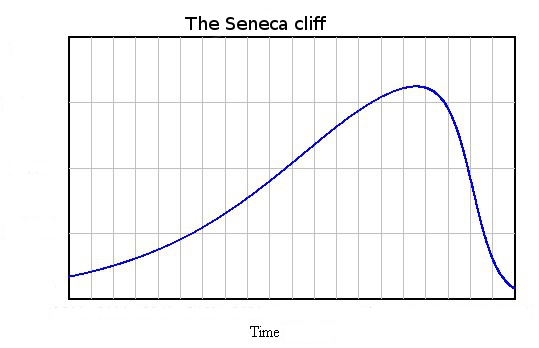
How should we expect an economy to behave over time? The pattern of energy dissipated over the life cycle of a dissipative system will vary, depending on the particular system. In the examples I gave, the pattern seems to somewhat follow what Ugo Bardi calls a Seneca Cliff.
Figure 1. Seneca Cliff by Ugo Bardi
Figure 1. Seneca Cliff by Ugo Bardi
The Seneca Cliff pattern is so-named because long ago, Lucius Seneca wrote:
It would be some consolation for the feebleness of our selves and our works if all things should perish as slowly as they come into being; but as it is, increases are of sluggish growth, but the way to ruin is rapid.

The Standard Wrong Belief about the Physics of Energy and the Economy
There is a standard wrong belief about the physics of energy and the economy; it is the belief we can somehow train the economy to get along without much energy.

In this wrong view, the only physics that is truly relevant is the thermodynamics of oil fields and other types of energy deposits. All of these fields deplete if exploited over time. Furthermore, we know that there are a finite number of these fields. Thus, based on the Second Law of Thermodynamics, the amount of free energy we will have available in the future will tend to be less than today. This tendency will especially be true after the date when “peak oil” production is reached.
According to this wrong view of energy and the economy, all we need to do is design an economy that uses less energy. We can supposedly do this by increasing efficiency, and by changing the nature of the economy to use a greater proportion of services. If we also add renewables (even if they are expensive) the economy should be able to get along fine with very much less energy.
These wrong views are amazingly widespread. They seem to underlie the widespread hope that the world can reduce its fossil fuel use by 80% between now and 2050 without badly disturbing the economy. The book 2052: A Forecast for the Next 40 Years by Jorgen Randers seems to reflect these views. Even the “Stabilized World Model” presented in the 1972 book The Limits to Growth by Meadow et al. seems to be based on naive assumptions about how much reduction in energy consumption is possible without causing the economy to collapse.


About Gail Tverberg


My name is Gail Tverberg. I am an actuary interested in finite world issues - oil depletion, natural gas depletion, water shortages, and climate change. Oil limits look very different from what most expect, with high prices leading to recession, and low prices leading to inadequate supply.


Free Logo From Thefreelogomakers.com


Wednesday, 17 February 2016

EYE on the World - Swiss Billionaire Says​,​ Massive Bank Crisis​ Hitting Singapore

Swiss Billionaire Says
​,​
 Massive Bank Crisis
​ 
Hitting 
Singapore

Inline images 1
Billionaire Felix Zulauf:
​ ​
 
​"​
A massive banking crisis is brewing in Singapore:
​"​


( Thanks to Jesse Colombo 
​, Forbes,  ​
for flagging this article
​ and tweet​
)


​Th​e global banking system is in rough shape as the house of cards created by giant credit-driven realty and stock market bubbles  in  China , Asia and elsewhere,  are tumbling down. Remember 2008? The first signs  began with - 

  Societe Generale pulling the plug on  US securitized mortgage debt in early August 2007, that then  triggering trading losses of  4.9 billion pounds  in January 2008.  Then  eight months  later  the crisis heightens and hits  North American  shores  causing a market meltdown, the fall of Lehman Brothers and the greatest banking bailout in US history. Guess what?  This one is much bigger. The consequences are assured to be much uglier .  


Also see
​ more signals​
 - 
​as ​
Singapore, 
​the ​
world’s 2nd largest port, container traffic fell 9% in 2015*, off 12% in January
​, too​
. *1st decline in 6 years:


https://twitter.com/Convertbond/status/698539301240442881


Canadian Banks Sure to Fall  with  Global System
( Thanks to 
 
Dan Mathisson
​, International Banking,​
​  
for flagging this article)

Inline images 2

Last time, the Canadian banks were pretty well  immune from the  financial tidal wave that devastated much of the global banking system  in 2008. This time will be a different story. Real estate bubbles in its major cities along with world-leading consumer household debt to disposable income are  thereby placing these national banks on all the international monetary watch lists.   More bubble, bubble troubles...  

Inline images 4
Another case of greedy CEO's levering their institutional balance sheets to create excessive personal bonuses. Grand larceny at its best, when it's done with a pen; not a gun!  So,  it's the same ole game, that begs the question - where are the boards?  More importantly, where are the regulators? Is everyone, since 2008,  "still asleep" at the switch?


They probably don't even know where it is!


Inline images 3


Monday, 15 February 2016

EIA's Predictions Questionable - OPEC Call is the Fudge Number!


Just How Accurate Are The EIA’s Predictions?


The EIA recently published the February edition of their Short-Term Energy Outlook. If you follow this month to month, and we do, you will notice their prognostications change a little every month. And over several months those small changes can add up to some rather dramatic changes. Nevertheless, below are several charts with their current oil production projections.
The EIA STEO only gives monthly data for total liquids. All C+C data is quarterly and annually. The monthly projected data begins in February 2016. Projections for quarterly and annual data begins January 2016.
ST Non-OPEC Liquids
The EIA says Non-OPEC total liquids dropped .5 million barrels per day in December and another .36 mbd in January. But then, other than another short drop in the first quarter of 2017, they see things leveling out for the next two years.
ST World Liquids
For the total world, the EIA expects far better production numbers than just for Non-OPEC. They expect new highs to be reached in 2016 and again in 2017.
ST US Liquids
They see US total liquids dropping in 2016 then they begin a slow rise through 2017, but not overtaking the peak in 2015.
ST Russia Liquids
Image result for putin badass
Apparently the EIA thinks Russia has had it. They see a drop in December 2016 then a huge drop in January  2017. We have no idea why. However the scale here makes the decline seem greater than it really is. From January 2015 to December 2017 the decline is only 400,000 barrels per day.
ST Eurasia Liquids

Adding the other FSU nations to the mix, mostly Azerbaijan and Kazakhstan, only exacerbates the decline, making it half a million bpd between January 2015 and December 2017.
ST Non-OPEC C+C A

Looking at just Crude + Condensate you get a better picture of what the EIA really expects in the next two years.  They expect Non-OPEC C+C to drop 580,000 bpd in 2016 and another 170,000 bpd in 2017 for a total of 750,000 bpd over the two years.
ST OPEC Total Liquids A
They are expecting far better things out of OPEC's gang.  They have the OPEC gangs total liquids up 1,010,000 barrels per day in 2016 and another 870,000 bpd in 2017. They do not project OPEC C+C.
But taking a closer look at their US Projections:
ST US C+C A
The EIA expects US C+C to drop 740,000 barrels per day in 2016 and another 230,000 bpd in 2017 for a total decline over two years of 970,000 barrels per day. 
ST US Liquids A  
However they have US total liquids faring much better then just C+C. They have total liquids declining by only 490,000 barrels per day in 2016 and increasing by 100,000 bpd in 2017.
ST US Other Liquids A
What this means is that US “Other Liquids”, that is NGLs, biofuels and refinery process gain must show a very impressive gains while everything else is going to pot. They show other liquids increasing by 250,000 bpd in 2016 and another 330,000 bpd in 2017. 
Most of this increase has to come from NGLs as biofuels are only a minor input and refinery process gain pretty much follows C+C consumption. But…
ST US Other Liquids % Increase 
Using their projections for Dry Gas production we find that gas production increased more than other liquids increased in 2015. However they say gas production will increase by only .4 percent in 2016 while other liquids increase by 4.6 percent, and a similar story in 2017 though not quite as dramatic.
Bottom line: We find the EIA’s past production data very accurate. However their projections appear to be pretty lame. This observation is proven out by the fact that those projections are constantly changing. Also, those “Other Liquids” projections seem to make no sense whatsoever. It appears to be mostly a fudge.  
Image result for yogi bear
But the very biggest problem with the EIA’s projections are with OPEC. That is because it is not a projection at all but an estimate of what will be needed to meet world demand. That is they estimate Non-OPEC production, then they estimate world demand, and the difference between the two will be the “Call on OPEC”. That is, they will simply expect OPEC to make up the difference, whatever that difference may be.
Lately, however, OPEC seems to be producing a lot more than their call asked them to. That is, they appear to be ignoring their call. And they will likely do likewise when they are expected to produce more to meet demand. They are all currently producing flat out and if there is a call on them to produce more, it will very likely go unanswered. 
WE thus  expect the “Call on OPEC” is a running joke between OPEC nations.

Image result for wile e coyote
______________________________________________________

Saturday, 13 February 2016

Peak Civilization or GDP?

Peak  Oil, Peak Everything 
By Peter Goodchild


http://www.survivepeakoil.blogspot.ca/2016/02/peak-oil-peak-everything.html

Perhaps the most common response to the peak-oil problem is: "The oil isn't going to disappear overnight. We have a century to prepare." Unfortunately, the fact that the decline in oil is a curve, not a vertical line, makes it difficult to comprehend. What matters is that the serious damage will have been done long before we get to those tiny remaining drops. That damage started around 1970, and it was not confined to oil.


Also, there are "curves within curves," so to speak. "Peak oil" in an ABSOLUTE sense was around 2010, but "peak oil" PER CAPITA was 1979, when there were 5.5 barrels of oil per person annually. According to UN estimates (admittedly quite uncertain), the world's population will rise to about 8 billion or more in 2030, whereas a look at the usual (or, at least, realistic) estimates for oil production show a decline to about 15 billion barrels in 2030, giving us a "per capita" figure of less than 2 barrels. That figure will not constitute an "on/off" situation, but by that year 2030 the human race should probably say goodbye to the Oil Economy.


It is not only oil, but in fact the entire North American economy that has followed something like a bell curve. In many ways it was not 2010, or any other year in the early 21st century, but the year 1970, that was the Peak, the Big Peak of Everything. Backward or forward on that curve, we see a dirty, noisy, crowded world. Right on that Peak, we see the Golden Age -- Beatlemania, "sex, drugs, and rock 'n' roll," Easy Street. As Dickens might say, "It was the best of times, it was the worst of times." The gap between the rich and the poor was not so bad in those days, whereas according to the US Census Bureau the mean income of the richest 5 percent of American families began to skyrocket shortly before 1970. In the year 1968, there was the Tet offensive, the turning point of the Vietnam War -- from an American military point of view, the downturn. In the year 1969, there was the first moon landing -- "the Space Age" began, although within a few years the expression (like "the Atomic Age") would be just an embarrassment.

The above-mentioned statement, "We have a century to prepare," also raises the question: Who is the "we" here? All human beings? A small group of dedicated survivalists? If the answer is the former, then the statement is false: humanity, as a whole, never makes any decisions. The human race, taken in its entirety, simply does not behave in such a sophisticated manner; the human race much prefers ignorance, superstition, cruelty, and intolerance. Robert Kaplan's book The Ends of the Earth is one of many texts that elucidate the harsh reality of human nature.

What about the coming several decades? Of course, a great deal depends on which time period one is discussing: the world of 2100 will be very different from the world of 2030. The question of slow versus fast collapse will also have a big effect on future scenarios. But if we look at tangible events of the last hundred years, two possible conceptions of the future stand out most clearly. These have best been illustrated by novelists (although not with peak oil as the setting) rather than by sociologists.

Image result for oil production 2100

The first is that of a slow slide into an impoverished police state, as illustrated by George Orwell’s 1984. In this scenario, government does not disappear. It is here to curse us forever. We may be poor and living in chaos, but we will live in relentless drudgery. This is roughly the same scenario as that of the Great Depression of the 1930s.

The second is that of a nuclear war that throws humanity back into a quasi-medieval world, as in Walter M. Miller, Jr., A Canticle for Leibowitz. In the fight for the remaining resources, civilization is largely destroyed. Such a scenario is just as plausible as that of George Orwell.


All civilizations grow too large to support themselves, and their leaders have little foresight. These civilizations then collapse and are buried in the sand. The same will happen to American civilization, but human shortsightedness prevents us from seeing it as only one among many. The USA, in other words, is seen as "civilization" in a generic sense, when it is really just one single civilization in a quantifiable sense. Unlike that of ancient Egypt, however, it is not likely to have a lifespan of three thousand years. Nor is it likely that another will take its place.


Watch  More


Earth In Trouble